Although my greatest aspiration in life has been to become a part of the video game journalism community, I have always had a bone to pick with the collective…critical…mass, as I have chosen to ambiguously entitle it.
The idea of rating the quality of video games must have arisen very naturally. As human beings, we are inclined to look to others’ reactions to all sorts of things, in order to aid us in the formulation of our own decisions and opinions about those things. Evolutionarily, it makes sense in terms of novel food items or potential mates, for example, because we would like to know if that berry on the bush is going to poison us, or if that partner we consider is of little use as a parent, thus making our offspring (genes) suffer. We are hard-wired through natural selection to gather feedback from other people on such critical matters, but humans also tend to apply these types of strategies to all situations that could cause us potential harm – in this case, lack of enjoyment, squandered time and liberation of dollars.
However, a sort of collective mind has developed in recent years. I sometimes feel as though only a few individuals ever have their own unadulterated opinions about games, before they are influenced by the omnipresent inundation of evaluations from other media sources. Oftentimes, a certain high-profile, big-budget publication will release an early review, and others will simply use it as a template for their own work. To review a game properly, I feel it necessary to go into it with a certain degree of ignorance, which is one of a few reasons I avoid reading in-depth PREviews. Please, let me experience the game for myself – fresh.
This group thinking trend is merely the tip of the iceberg, and is a precursor to my primary complaint about the way games are rated.
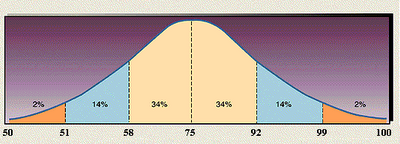
In any sample of data points, there will be a noticeable tendency toward a particular point on the scale. Most commonly, it is the central value between the upper and lower limits of the range of numbers. This central tendency is described by the central limit theorem, and illustrated by what’s called the normal distribution.
The normal distribution is what’s commonly referred to as a “bell curve.” It shows the mean (average) at the 50th percentile, or 5 out of 10. Manually taking the average of the numbers 0-10 will obtain the same results.
(0+1+2+3+4+5+6+7+8+9+10)/11 = 55/11 = 5
One would expect the ratings of video games, or any other form of media, to disperse across the range in a similar fashion. Five should be an average score.
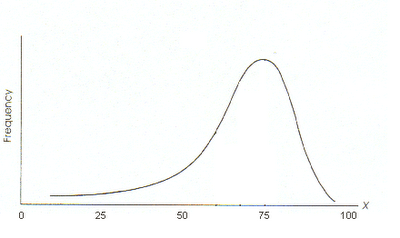
Unfortunately, in the realm of video game journalism, this is not the case. When examined as a group, rather than center around the expected mean (50%), video game ratings are a perfect example of what is called a negative skew.
I have labeled this phenomenon “IGN Syndrome,” in reference to the notoriously high ratings awarded by that particular publication. The real problem here, though, is that most other sources follow the same path. It is as if we have lost half of the range of scores, and are left with a set of 50-100. This is where the VAST majority of scores lie. Luckily, there is a clear and recognizable reason for this particular skew. We need look no further than our public school system.
It is rare occasion that a school works on any grading system other than the 100 point scale. It is a percentile, and easy for students, parents and teachers to grasp. Further breaking down this system, we encounter the letter grades, A-B-C-D, which correspond to the range of scores from 100% down to 65%. An F is anything below 65, and is a FAILING grade. In essence, a roughly 50-point scale exists in institutionalized education, due to the fact that any score falling below that range is equivalent anyway. So, the educational bell curve that game critics are now emulating would look something like this:

This makes sense in the particular setting, considering the dropout/flunk rate in high schools in The U.S. is roughly 30%. Some simple math shows us that this percentage coincides perfectly with graph’s distribution.
score-range=x x/range=%
65-50 = 15; 15/50 = 30%
However, video games are not children, and they are not in school. A rating of 30% should remain a 30%. It should NOT be called 65%. Sure, games would seem generally less magnificent when looking solely at the numbers, but it would also leave some much needed room in the upper portions of the range to distinguish the quality differences between titles. Cramming all ratings into a smaller space makes it difficult to separate game x from game y when one is ever so slightly better than the other.
After expanding the range, ratings would become much more valuable, too. For example, let’s take a grade of B+ on the educational scale, which is roughly equivalent to an 88%
88-50 = 38; 38/50 = 76/100 = 76%
By converting a B+ from that system to the system based on a normal distribution, we see that a 76% would suddenly become a very respectable score. If we were to take an 88% from the normal distribution and convert it back…
88% = 88/100 = 44/50; 50+44 = 94 or an “A”
…then we see that an 88% is an excellent rating.
I have drawn up a rating scale that is based off of the normal distribution, and what I feel it means in terms of game quality. This will be the basis for all of my personal game reviews:
9.5-10 : Best of its kind. Changes gaming. Revolutionary. These are the games EVERY SINGLE GAMER should possess, or at least experience at some point, preferably immediately.
8.5-9.5: Outstanding. Minor imperfections. “Must-buy.”
7.5-8.5: Great. Games in this range are well above average and deserve your money. They will make you happy.
6.5-7.5: Solid. These are games that are enjoyable and well-made. They may not push the envelope, but they make a good showing right there within it.
5.5-6.5: Slightly above average. Looking past a few flaws will serve to find a good time with these games.
4.5-5.5: Mediocre. Playable, but not offering anything especially interesting.
3.5-4.5: Below average. Maybe rent it. Maybe not. There are lots of better games out there.
2.5-3.5: Not fun. Possibly frustrating. Various states of BROKEN.
1.5-2.5: Crap. Better off used for some alternative form of entertainment, like frisbee.
0.0-1.5: Why was this ever made? ET. Superman 64. BARF!
Unfortunately, certain gaming sites list their ratings guides, seeming to approximate a normal distribution like this, but then the aggregate of their reviews blatantly fly in the face of any such regularity. The ratings remain skewed towards the top of the range. So is it possible to initiate a change in the way games are rated? Maybe not, due to the vast body of content out there. A joint effort to collectively retrofit this new system to an older industry might prove to create too much discontinuity, with older games appearing to be better, simply because of the scale on which they were rated. Some distinction would have to be made between those games reviewed “before normal” and those reviewed under the “normal” distribution.
In any case, the ratings systems of the majority of today’s gaming publications are off track, and do not provide the clearest possible picture for the gamer. I advocate a change in the way games are compared and analyzed.


